|
STATISTICS ........................... Age
Language
Chart shows percentage of - use of native language - use of English (non native) - use of German (non native) - use of French (non native) Gender
F female M male Chart shows percentage of - female participants choosing female successors - female participants choosing male successors - male participants choosing male successors - male participants choosing female successors Centers
*other: less than 2 % Migration of participants 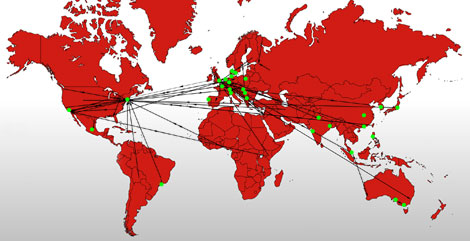 Black arrow shows participant migration between place of birth and residence. Green dot shows no change of residence. Migration of contributions 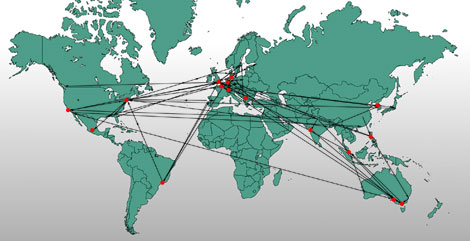 Black flash shows distance between participants and nominees. Red dot shows participant choice of nominee in the same place. |